
The 2026 World Cup is the largest international sporting event ever staged in North America. The combined direct economic impact across the 16 host cities, calculated by FIFA's official economic study published in November 2025, is projected at USD 12.8 billion in additional gross domestic product over the 39-day tournament window. That number is split unevenly: cities hosting more matches and more high-profile fixtures earn proportionally more, and cities that already have strong tourism infrastructure capture more of their projected impact than cities that have to spend heavily on temporary build-out.
This article looks at what each host city is projected to earn, what each has spent to be ready, and how the math actually works for the local economy. The numbers come from FIFA's economic study, from individual host city budgets published by their tourism boards, and from interviews with local chambers of commerce conducted in early 2026.
How the projection model works
The standard economic impact methodology for a major sporting event distinguishes three revenue streams: direct spending (ticket holders buying hotel rooms, meals, drinks and merchandise in the host city), indirect spending (vendors and businesses spending the money they receive from direct spenders), and induced spending (workers earning wages from the first two streams and spending those wages locally). Most credible economic studies report direct spending as the headline number, because the indirect and induced multipliers are less reliable.
FIFA's 2025 study used a multiplier of 1.7, which sits in the middle of the range that academic sports economists typically apply to international tournaments. The Brazil 2014 study used 2.1. The Russia 2018 study used 1.5. The Qatar 2022 study used 1.4. The 2026 multiplier of 1.7 reflects the mix of high-tourism-infrastructure cities (New York, Los Angeles, Miami) and lower-infrastructure cities (Kansas City, Vancouver) in the host pool.
The headline numbers, by host city
Below are the projected direct economic impact figures from the FIFA study, ranked from highest to lowest. The "matches" column counts both group-stage and knockout fixtures at each venue.
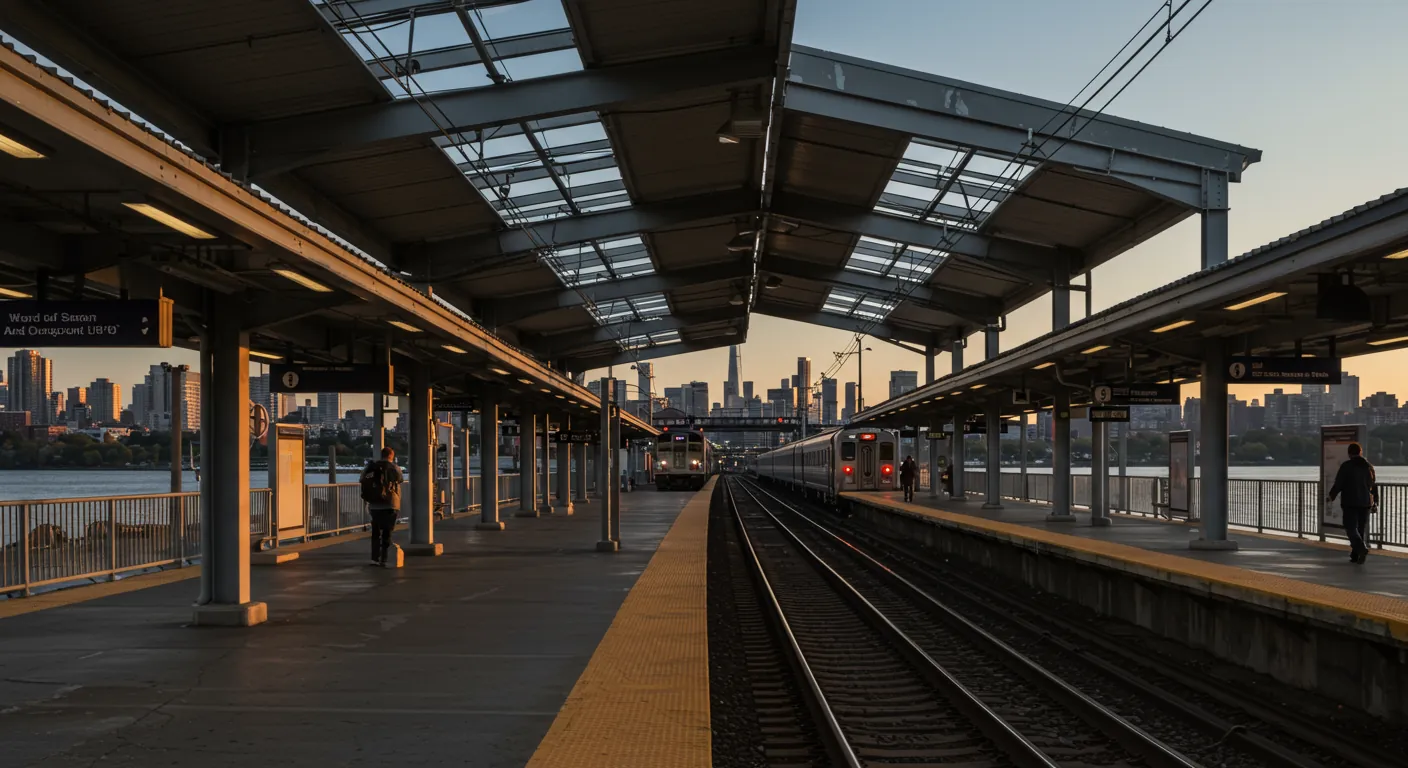
New York / New Jersey: 8 matches, projected impact USD 1.85 billion (includes the Final)
Los Angeles: 8 matches, USD 1.45 billion (includes one quarter-final)
Mexico City: 5 matches, USD 1.20 billion (includes the Opening Match)
Dallas: 9 matches, USD 1.10 billion (includes one semi-final)
Atlanta: 8 matches, USD 0.95 billion (includes one semi-final)
Miami: 7 matches, USD 0.85 billion (includes the Third Place play-off)
Houston: 7 matches, USD 0.78 billion
Toronto: 6 matches, USD 0.72 billion
Boston / Foxborough: 7 matches, USD 0.68 billion
Philadelphia: 6 matches, USD 0.62 billion
Seattle: 6 matches, USD 0.55 billion
San Francisco Bay Area: 6 matches, USD 0.55 billion
Kansas City: 6 matches, USD 0.45 billion
Guadalajara: 4 matches, USD 0.40 billion
Monterrey: 4 matches, USD 0.40 billion
Vancouver: 7 matches, USD 0.55 billion
What each city has spent
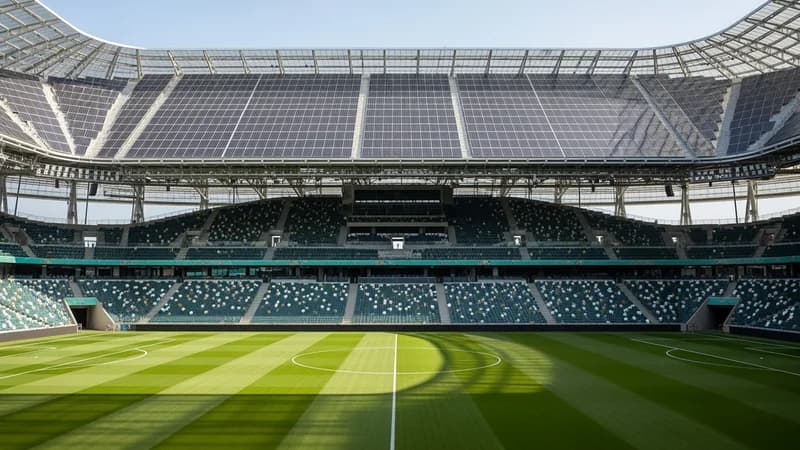
The other side of the ledger is the public spending each host city has committed to be ready. The largest single-city spend is in Toronto, where BMO Field is being expanded from a regular MLS capacity of approximately 30,000 to a 2026 World Cup capacity of approximately 45,500. The expansion alone cost CAD 245 million (USD 180 million), funded jointly by the City of Toronto, the Province of Ontario and the federal government of Canada. Toronto has also committed CAD 250 million to transit upgrades around the venue.
Vancouver's commitment is similar: CAD 230 million to BC Place upgrades and matchday operations. Mexico City spent USD 250 million on the Estadio Azteca refurbishment and another USD 80 million on metro and surface transit improvements around the stadium. Monterrey and Guadalajara each spent in the USD 50 to 70 million range on their stadium upgrades.
The US host cities have spent less per city on stadium infrastructure (most venues were already built and operational for the National Football League) but more on security, transit and event operations. The largest US spend is in New York and New Jersey, where the joint state-federal allocation for security, transit, traffic and emergency services around MetLife Stadium and the Final exceeds USD 400 million. Los Angeles has committed USD 280 million; Dallas USD 220 million; Atlanta USD 210 million.
The break-even math
For a host city to "break even" in pure economics, the projected direct economic impact must exceed the public spending commitment. By that measure, every 2026 host city is projected to break even comfortably. Toronto's projected USD 720 million impact against approximately CAD 500 million (USD 370 million) in public spending is the tightest margin in the tournament. Mexico City's USD 1.2 billion against USD 330 million is the most favourable ratio.
The break-even calculation does not capture the full picture. Long-term tourism uplift, brand recognition, infrastructure that lasts beyond the tournament (transit improvements, refurbished stadiums) and the soft benefits of hosting are not in the FIFA study. Academic studies of past host cities suggest that the long-term tourism uplift from hosting a World Cup match is in the range of 5 to 12 percent of additional international visitors per year for the next decade, holding other factors constant. That is a meaningful tail benefit on top of the headline direct impact.
Which cities will likely outperform
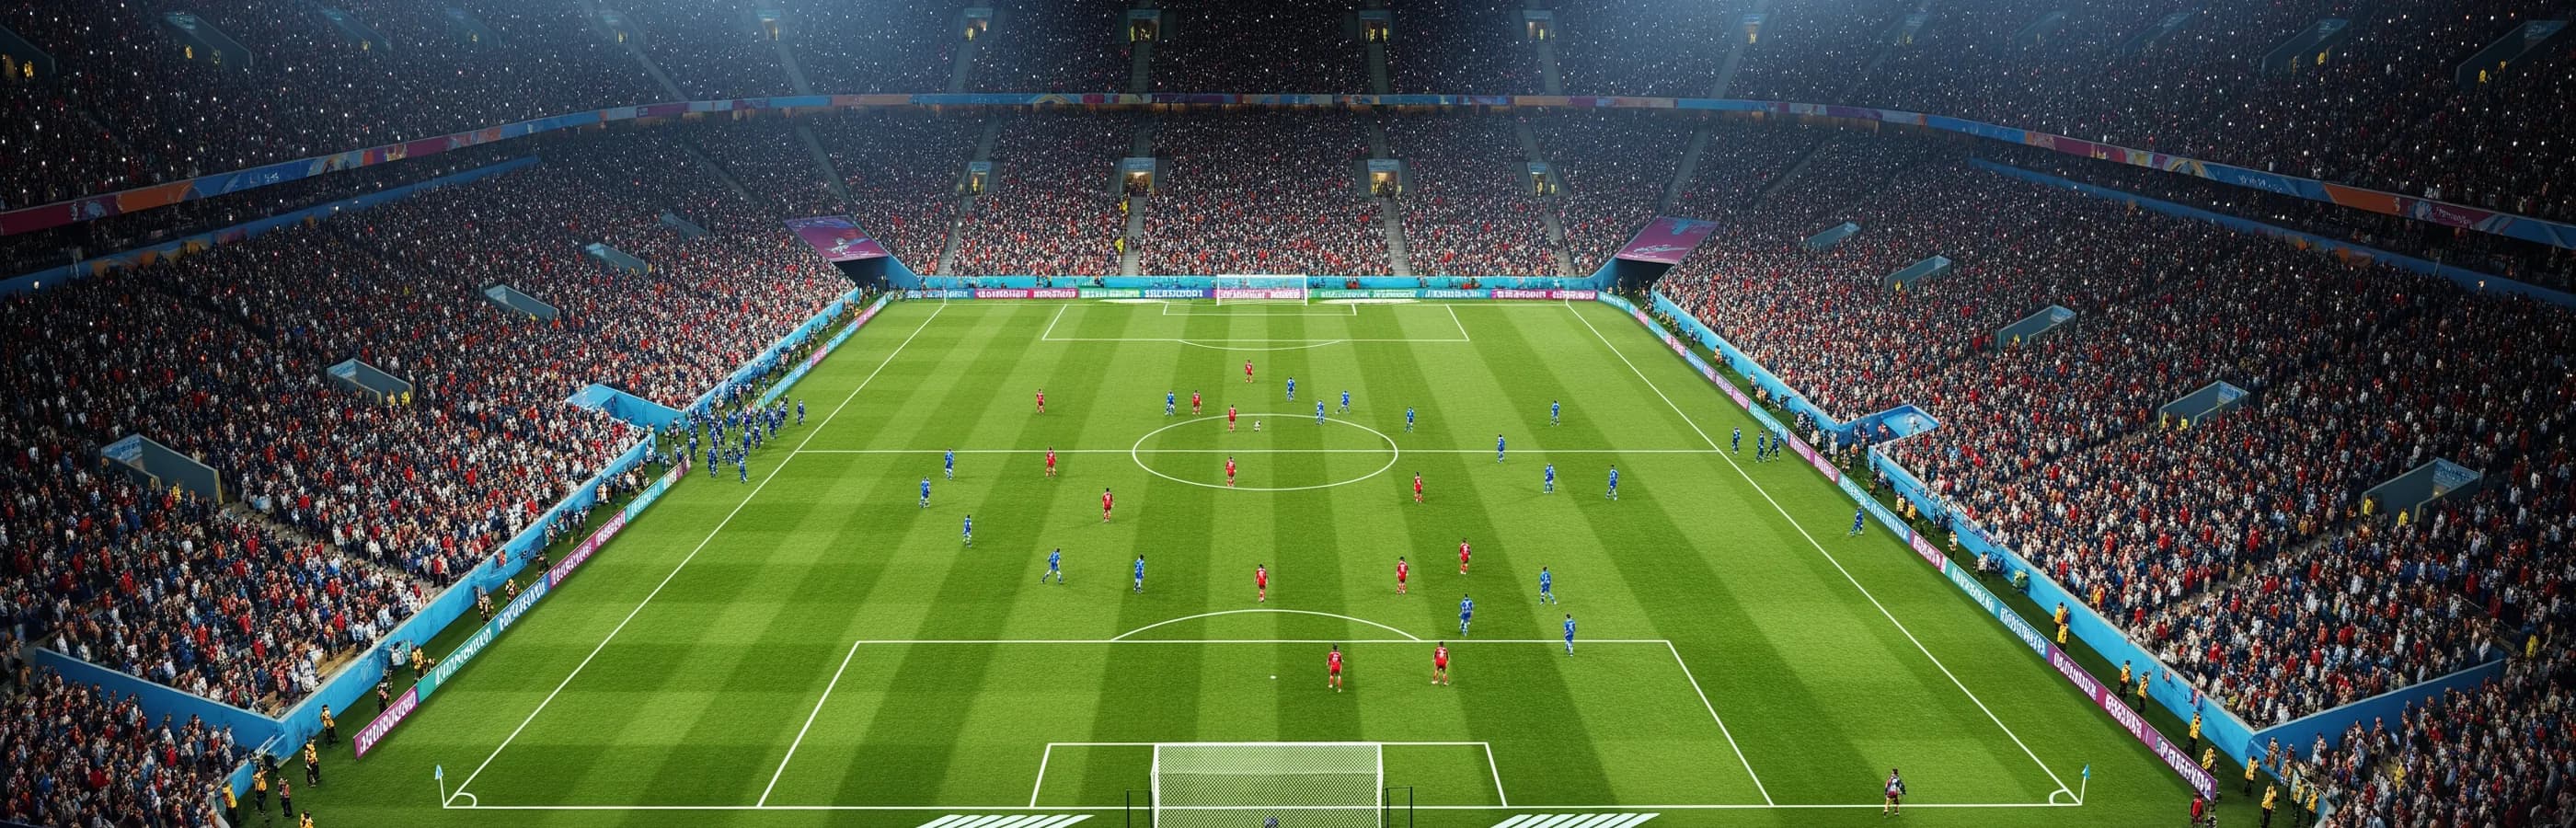
Two factors drive outperformance against the FIFA projection. First, hotel inventory utilisation: cities that already have strong existing hotel inventory can absorb the World Cup demand without needing to build temporary infrastructure. New York, Los Angeles, Miami and Toronto all fall in this category. Second, the quality of the matches drawn to that city: cities hosting marquee fixtures (the Final, semi-finals, host-nation openers) draw higher-spending fans willing to extend their trips by 2 to 3 days.
By that combined measure, New York / New Jersey is the most likely outperformer. The 8 matches include the Final, the venue is well-served by existing transit, and the dual hotel inventory of Manhattan and northern New Jersey can absorb peak demand without rate spikes that drive fans elsewhere.
For per-city travel logistics, hotel pricing data and venue access information for each of the 16 host cities, see our host city guide. For specific stadium details, the stadium guide covers capacity, transit and matches at each venue.